EMA on Price Charts
The EMA, like other moving averages, is the line that runs alongside the price bar. It can be positioned above or below the bar or may intersect with it at different points, depending on the stage of the market.
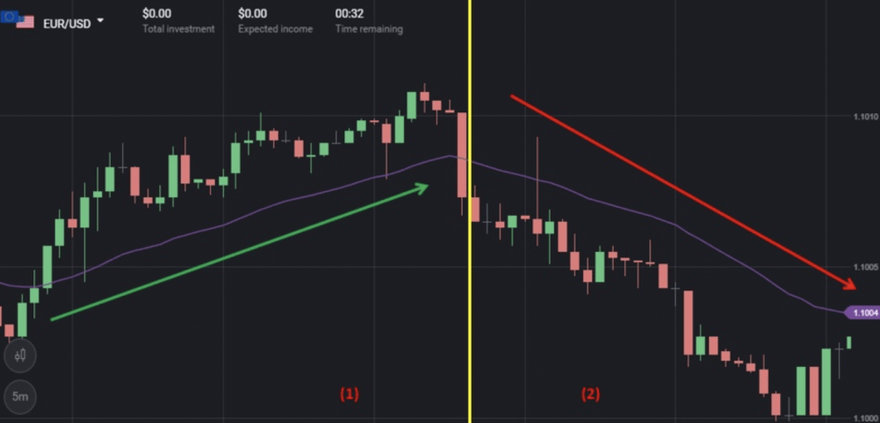
The picture above shows:
- Zone (1): When the EMA (purple) stays below the candles, it means the market is going up
- Zone (2): When the EMA (purple) goes above the candles, it means the market is going down
When the price and the EMA keep crossing each other, the market is going sideways. Traders on Binomo use the EMA to predict trends and enter trades more efficiently.
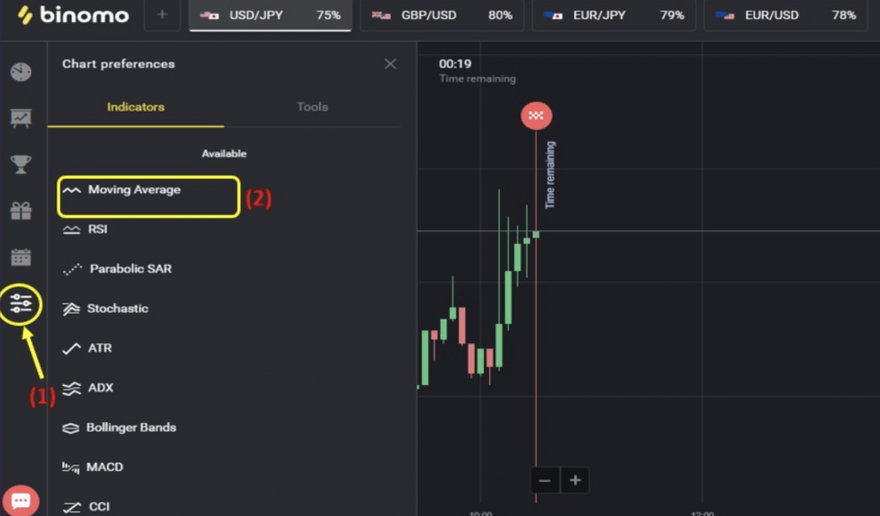
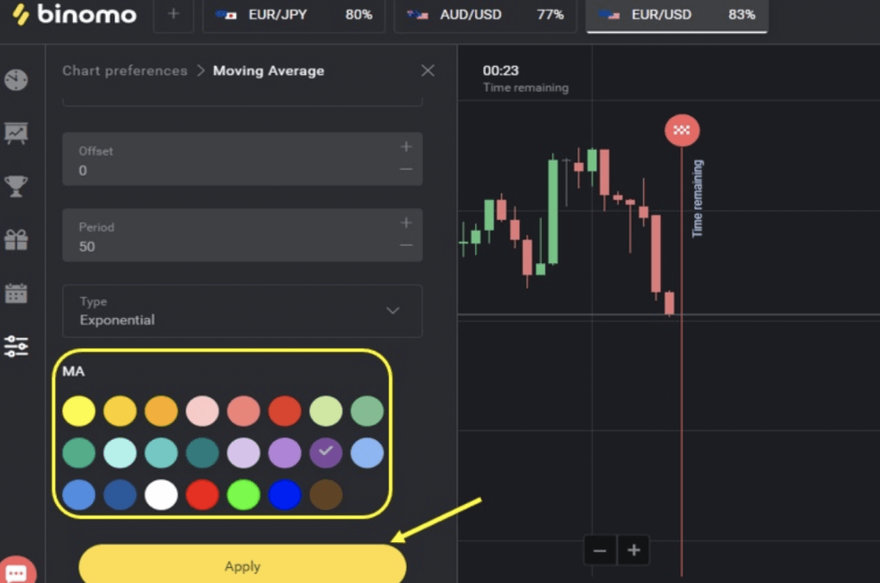
Setting Up EMA Indicator in Binomo
To add the EMA line in Binomo:
- Go to the Indicators menu
- Select the MA option (moving averages)
- Set candles for indicator calculation (recommended EMA settings: 30 and 50)
- Choose exponential moving average
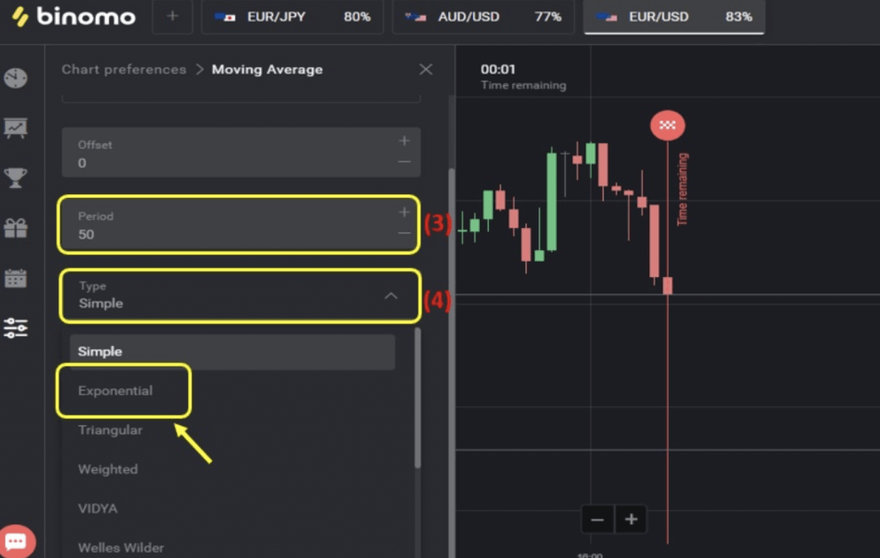
Next, customize the color of the EMA line. Finally, click Apply to finish the setup.
EMA Trading Strategies
To trade on Binomo, use the EMA to build quick and trend-following strategies. These strategies require a 5-minute Japanese candlestick chart, EMA (30), and an expiration time between 5 and 15 minutes.
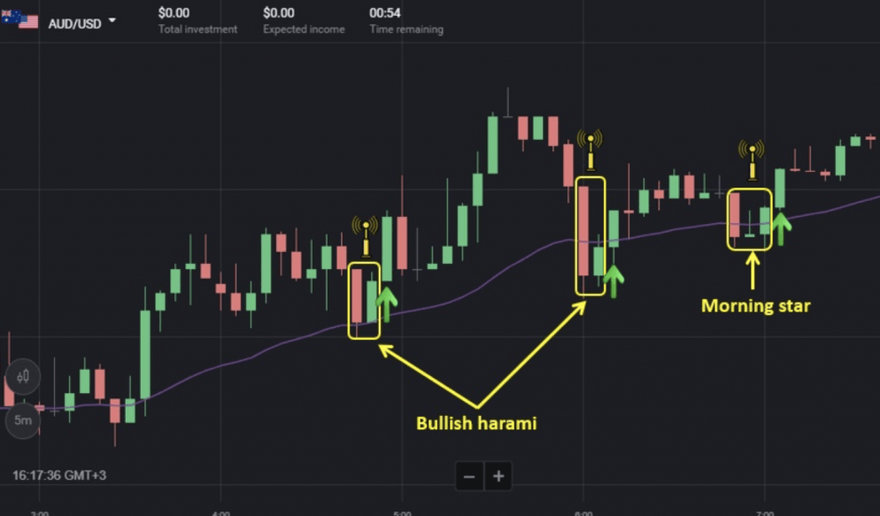
Strategy 1: Using EMA and Candlestick Patterns (Engulfing, Harami, Tweezer, etc.)
The EMA is the dominant signal in this strategy. Observe the price movement within the trend and test the EMA to create candlestick patterns. For example, click UP in an uptrend tests the EMA with a bullish reversal candlestick pattern (such as Bullish Harami, Morning Star, Bullish Pin Bar, etc.).
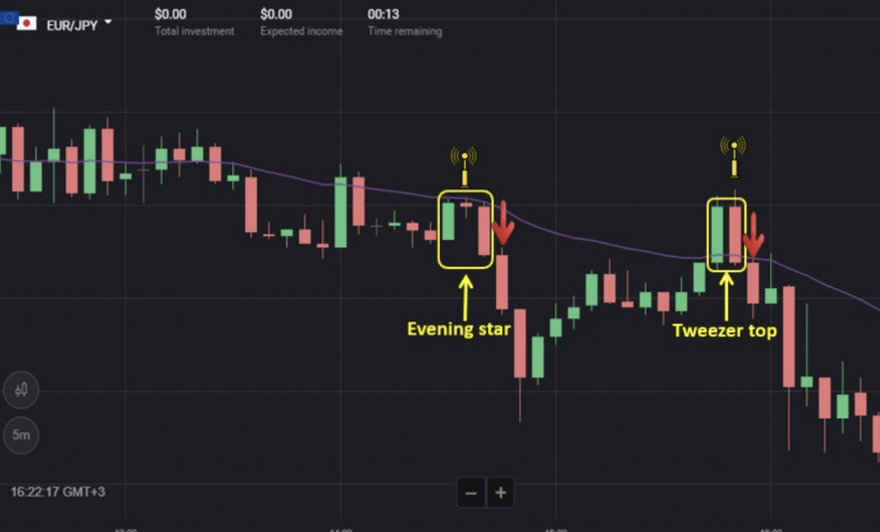
Click DOWN if the price is in a downtrend and tests the EMA with a bearish reversal candlestick pattern (e.g. Evening Star, Tweezer Top).
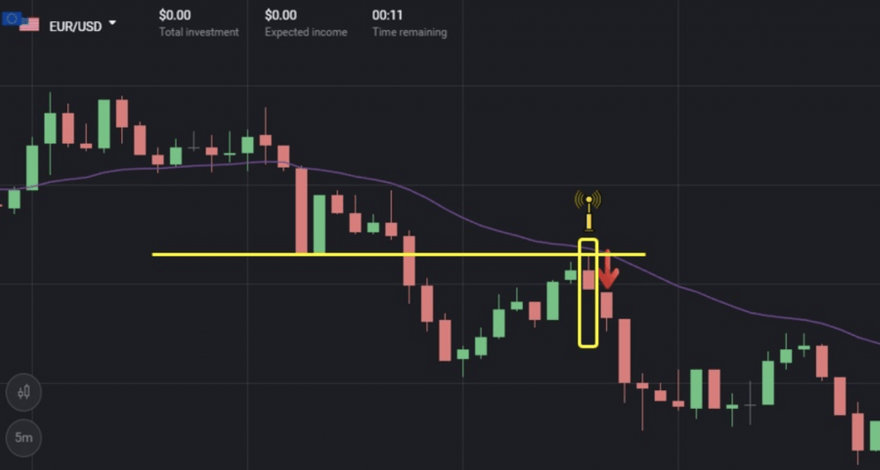
Strategy 2: EMA Combined With Support/Resistance
Prices strongly react in support or resistance zones. This strategy uses those zones and the EMA as levels to buy or sell. For instance, if the price tests the EMA in the support zone, then the trend is up.
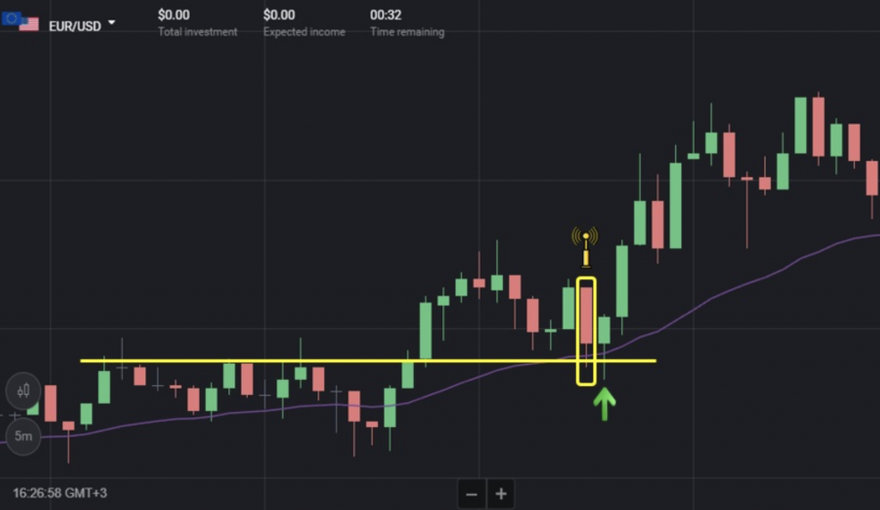
When the price hits the EMA in the resistance area, call it DOWN. EMA is quite popular in trading. Try EMA on a demo account to get better at using it.