The trend's relativity
Trends describe how prices move. An uptrend happens when prices keep going higher and higher, while a downtrend is when prices keep going lower and lower.
But trends aren't always clear. Prices can stay the same for a while, and this is called consolidation. During consolidation, uptrends have lower peaks and valleys, and downtrends have higher peaks and valleys.
Prices will move between two levels called support and resistance. The ease of recognizing a trend depends on how often look at the prices. Frequency of price-checking affects ability to recognize trends. The charts below demonstrate the difference between looking at prices every 5 minutes versus every 10 minutes.
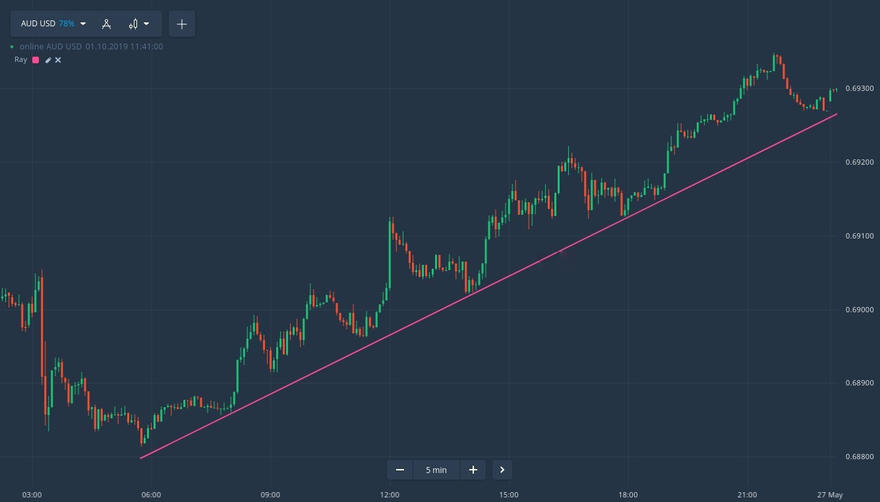
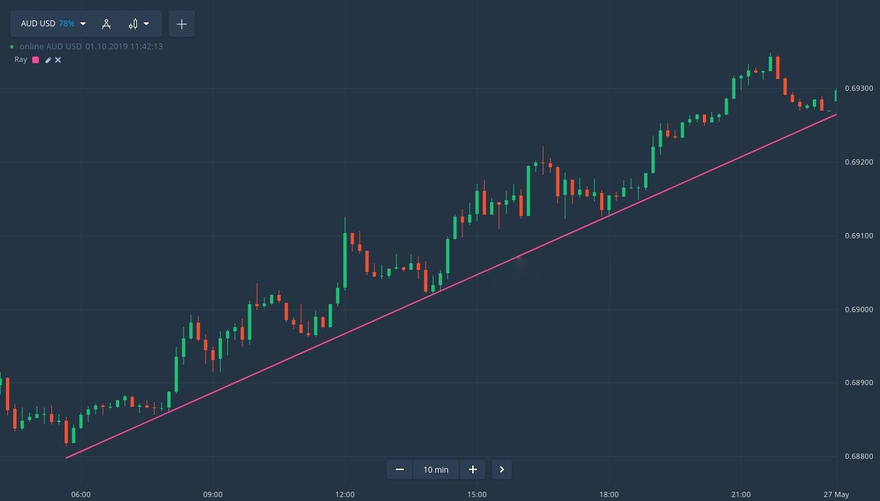
Reading the chart with a higher interval is simpler and makes it easier to identify trends and narrower price consolidation areas. Additionally, one can see the price moving closer to the trend line after consolidation.
2 Trend-Based Trading Methods on Binomo
To trade successfully on Binomo, it's important to know how to identify trends. Then, use the trend to find good trading opportunities. Remember to always trade in line with the trend. Here are some tips to help get started.
Trading with Breakouts
To trade with breakouts, first identify the support lines in a downtrend. Sometimes, the price touches the support lines. Enter the market when the first bearish candle goes below the support level.
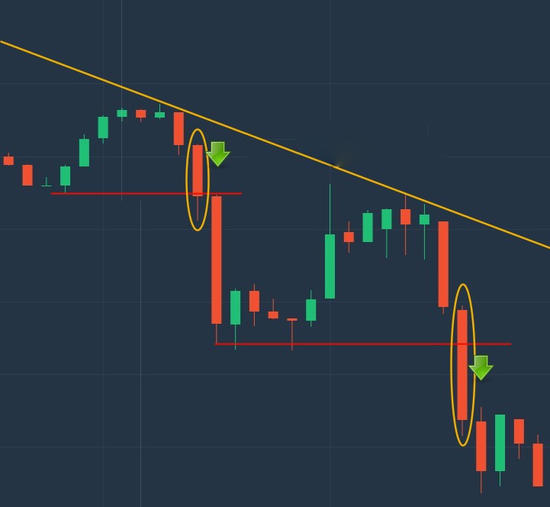
Trade when the price goes down
As shown in the chart, the price is decreasing. There's a line that shows the direction of the trend and another line that shows where the price has been stopped in the past. When the price hits the point where these two lines meet, it will most likely continue to go down. This is a good time to sell.
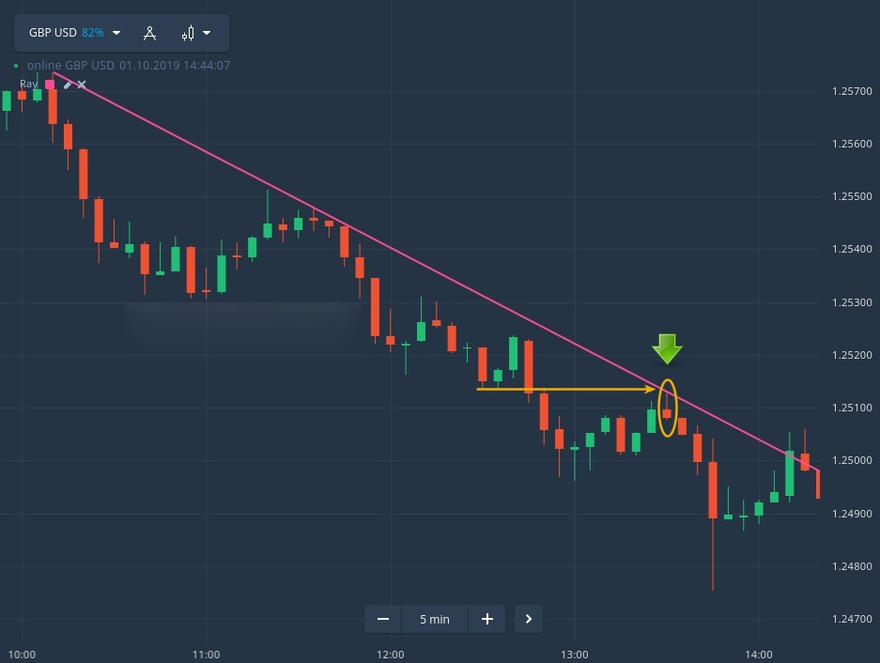
Here are a few more examples. Please refer to the chart below.
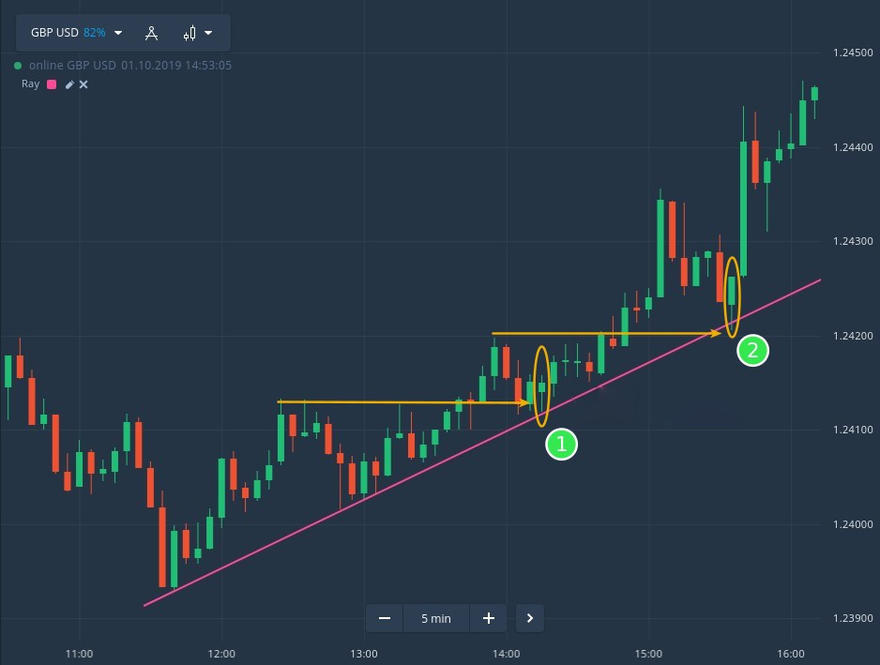
- A new trend has emerged. The price retraces to the former resistance line, which now acts as support. A bullish pinbar appears, testing the support level and trendline simultaneously, creating a strong setup to go long
- The bullish candle touches the trendline, indicating that the strong uptrend will continue. It also touches the support level, making it a good time to enter a buy position
To identify trends, use longer candle intervals and charts (such as 3 hours to 1 day). Drawing a trend line involves connecting high-lows for uptrends, and low-highs for downtrends. Identify support/resistance levels and watch for price breakouts. Entering a position in line with the trend's direction after a breakout can be a good strategy.