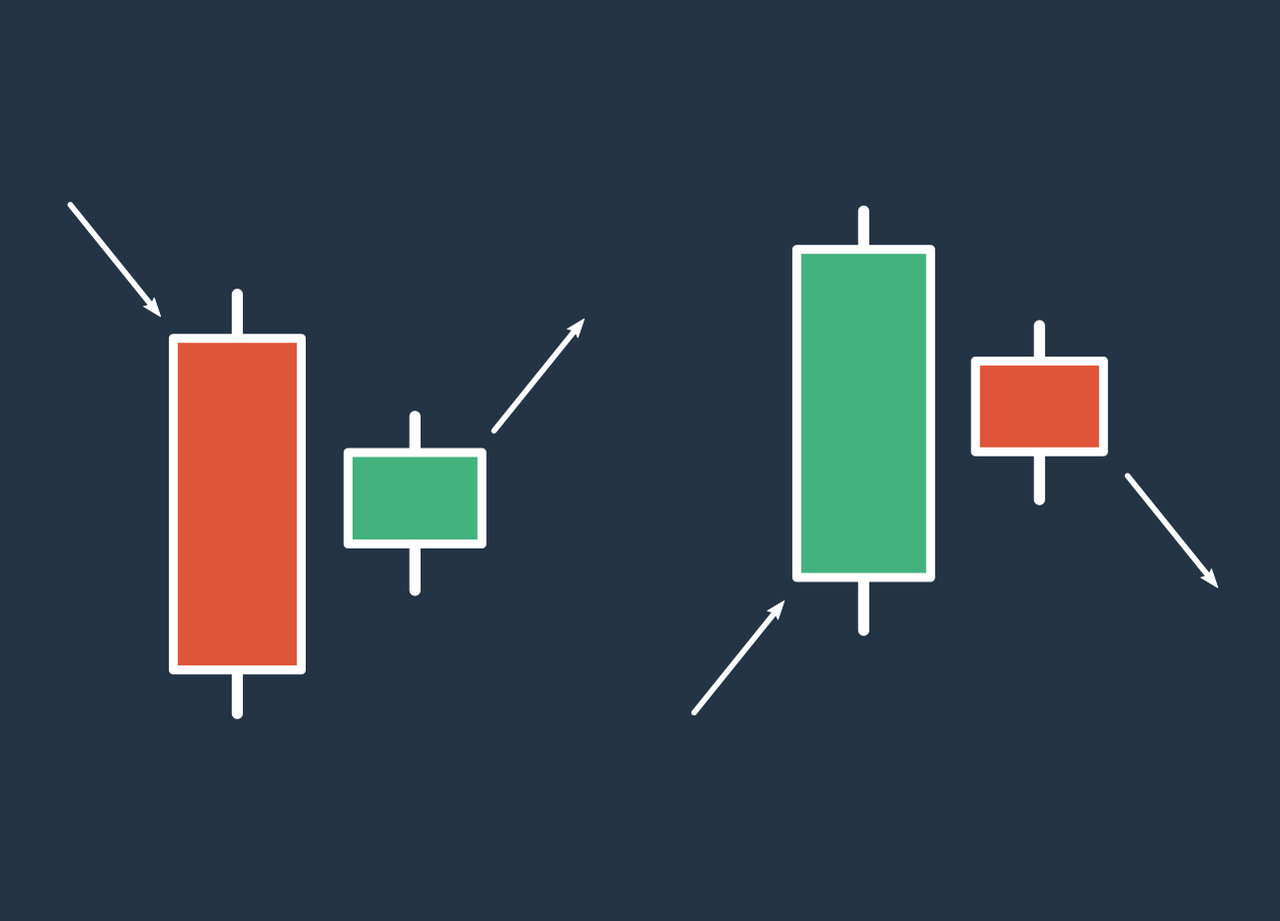
The Harami pattern indicates the end of a trend and is made up of two candles. The first candle is long and green in an uptrend, or red in a downtrend. The second candle is short and colored opposite to the first candle, meaning it is a short red candle in an uptrend, and a short bullish candle in a downtrend.
How to Read the Harami Pattern
The candles in a trend are usually the same color, and when there's a long candle, it means the trend is strong. But if a candle in a different color appears, it could be a sign of a trend change. In the Harami pattern, the opposite-colored candle is much shorter than the previous one and usually happens inside its body. If trader see Harami candles, it's likely the trend will reverse. Otherwise, the price will correct before the market continues in the same direction.
Harami pattern trading on Binomo
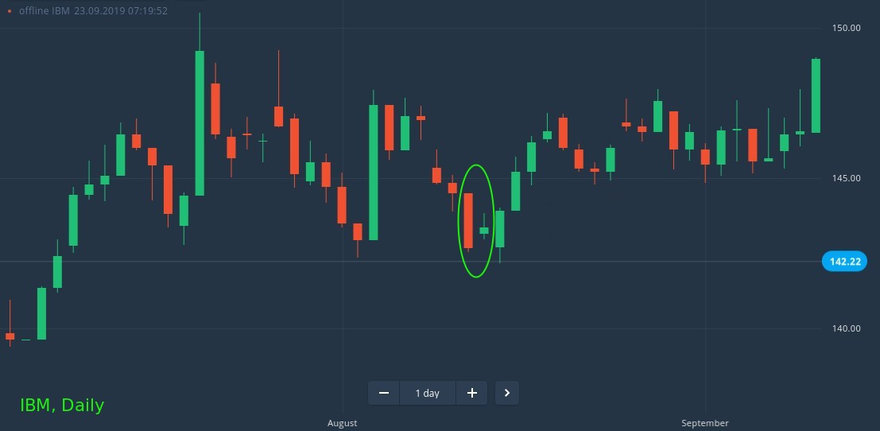
To deal with the uncertainty of whether Harami candles indicate a trend reversal or price correction, it is best to use the pattern for long term trading. In the chart example, a timeframe of 1 day is used and the position should be entered when the third green candle develops, indicating an upward trend. Trading interval should be 1 day. Test the Harami pattern on the free Binomo demo account before trading for real. Keep in mind that there is no risk-free strategy and losses are likely. Be prepared for things not going according to plan.