Recognizing the Rectangular Price Pattern
In a ranging market, prices rise to a certain point and fall back down. This creates resistance and support levels that are strong enough to cause the price to bounce back without breaking them.
To draw these levels, add lines that are parallel to each other. The support line is created by joining at least two bottoms, while the resistance line connects at least two tops. See the 30-minute DAX chart below for an example.
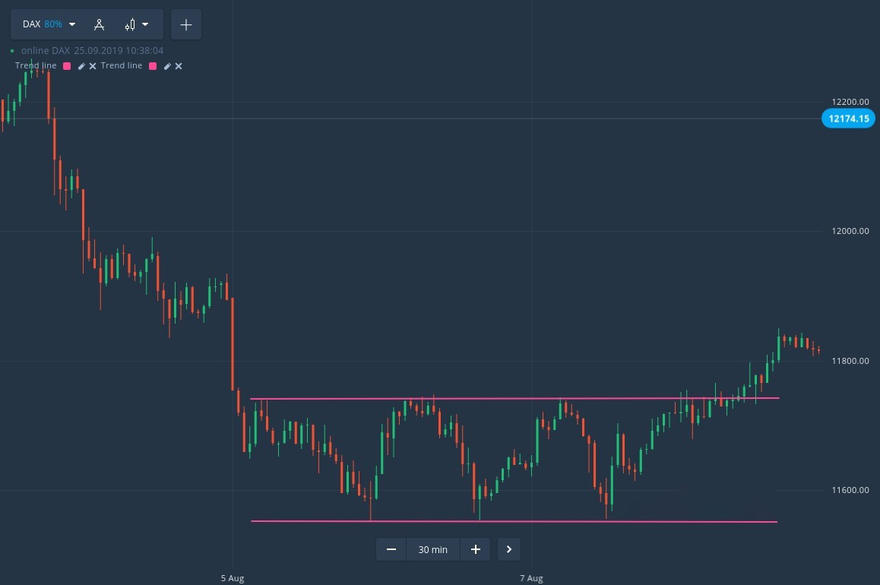
The rectangle pattern indicates the end of a trend and a change in direction. It is visible at the top of an upward trend or the bottom of a downward trend. This signifies the end of directional movement and the start of a trend reversal. During this time, prices remain within a certain range.
Trading the Rectangular Price Pattern
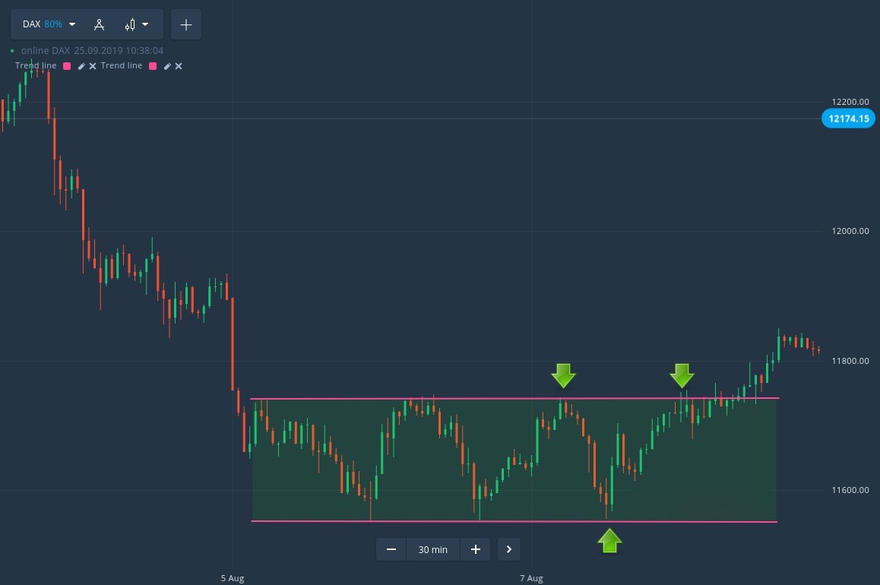
To take advantage of the rectangular price pattern, begin by drawing support/resistance lines and identifying moments when the price reaches these lines. If the price hits the support line, open a buy position. If it hits the resistance line, open a sell position. For short-term trades, use a chart with a large time frame and open trades with a shorter expiration time, such as 5 minutes. This ensures that the price remains within the rectangle and doesn't rebound before trade ends.
Trading after Price Breakouts
Be prepared for the moment when the price breaks the support or resistance level. It is inevitable. Observe the direction of the price after the breakout and make trades accordingly. If the price breaks the resistance level, like in our example chart below, buy in, as the uptrend is developing. Find more information on trading after price breakouts in our guide.
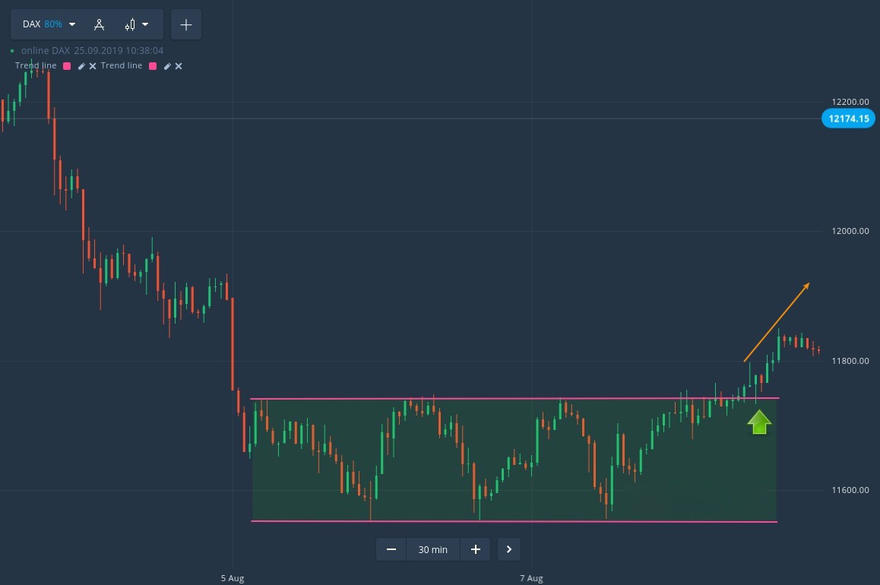
In the price boxes pattern, the price fluctuates within a range until it breaks the barrier with significant momentum. Trader can identify this by observing long candles of the same color, which indicate a move in the breakout direction and allow to enter the trade in line with the trend.
Keep in mind that while the rectangular price pattern can be useful, it is not a guaranteed success and there is always a risk of losses in the financial market. Practice on a free demo account before using it on a real Binomo account.