The Momentum Indicator
The Momentum indicator is a technical tool that can help predict how the price of a financial instrument will change over time. It works by comparing current and past values to estimate the speed of price movements. Trader can use the signals from the Momentum indicator to make more informed decisions when buying or selling financial instruments.
Momentum Signals for Trend Reversal
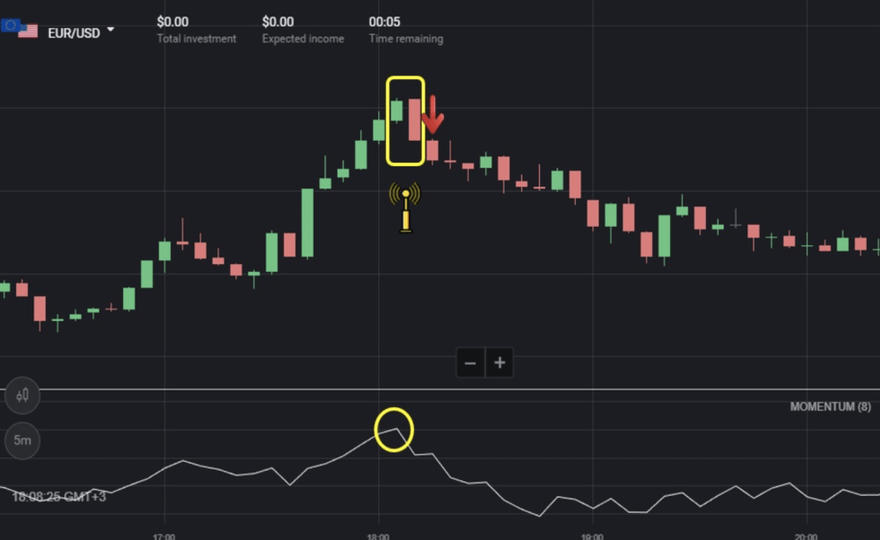
When the price reaches the end of a trend, momentum builds to a peak and then changes direction, creating a signal that indicates a likely reversal of the price trend in the future.
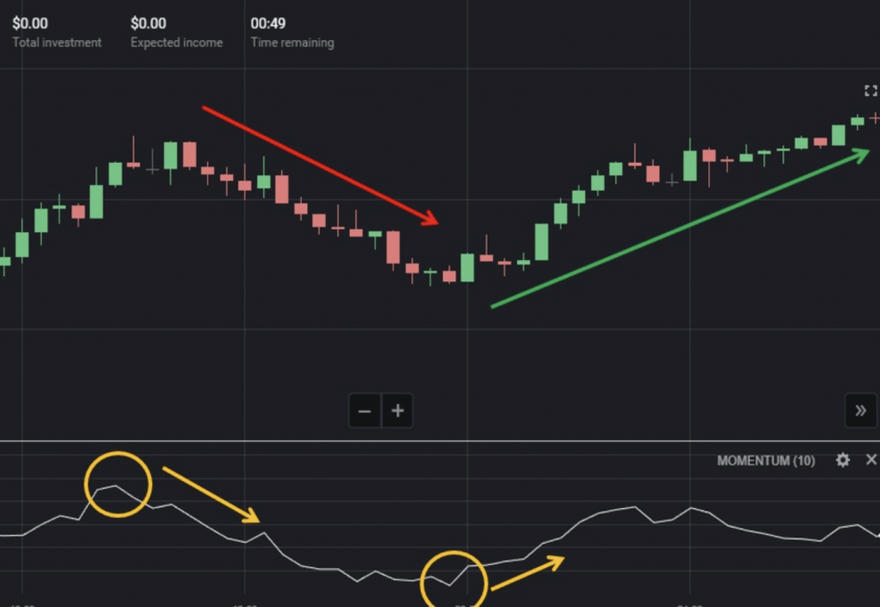
Trend Continuation Indicator
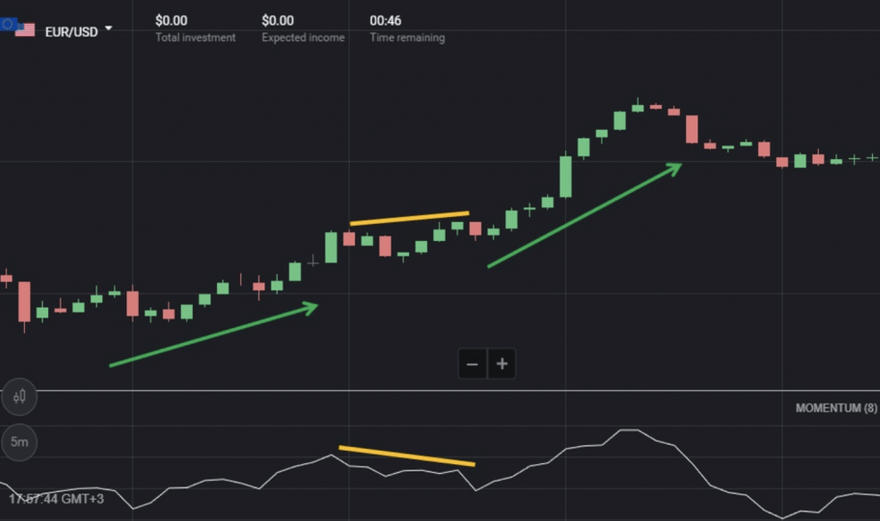
This signal requires careful observation before it can be recognized. For instance, there is a phenomenon called the divergence between price and indicator. After this period, prices will likely continue to rise in the future. This means that when the price maintains its uptrend, despite going up or sideways, the Momentum shows signs of a bearish trend.
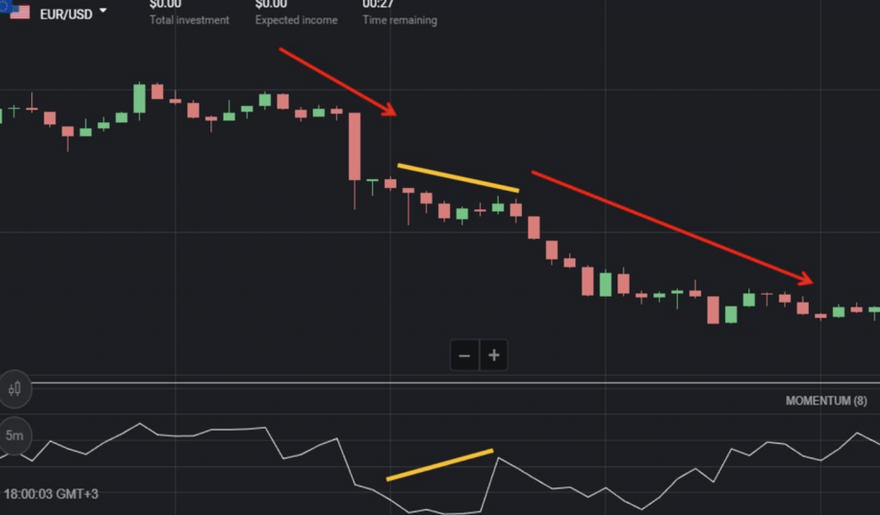
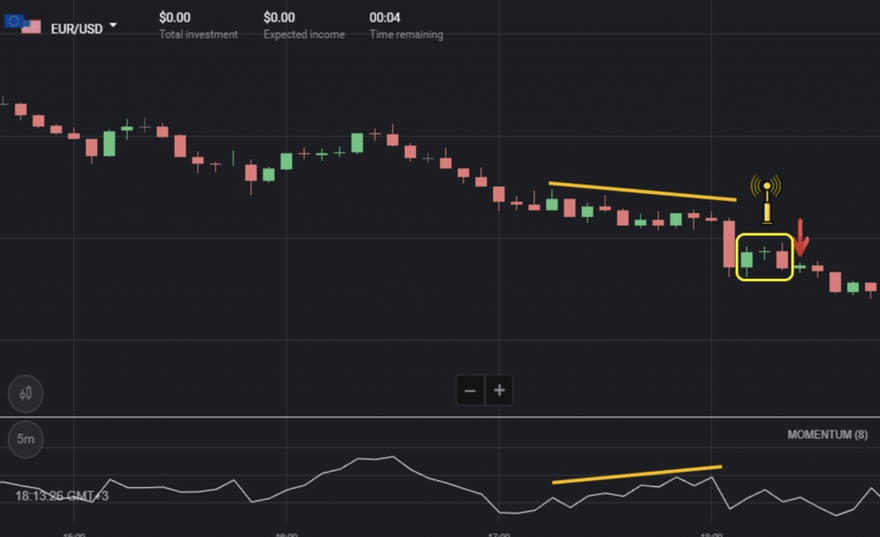
When the price is decreasing or moving laterally (in a downtrend) but the Momentum is increasing (on a bullish trend).
How to Use Momentum Indicator in Binomo
- Open the Indicators menu
- Select the Momentum indicator
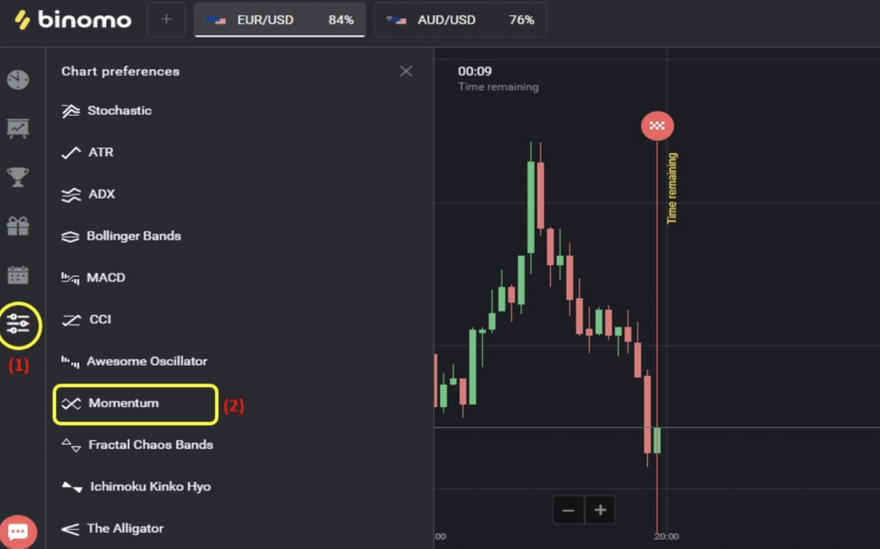
- Choose the number of candles that Momentum computed
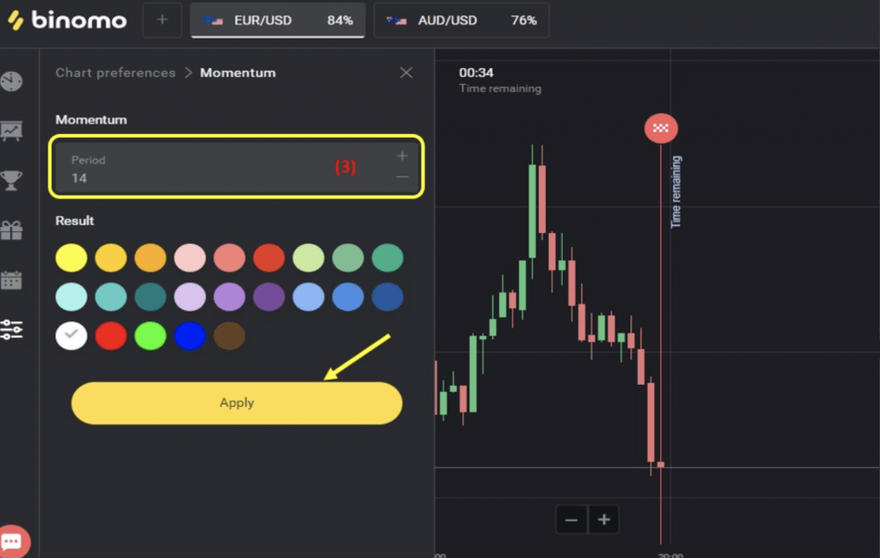
Next, set the color, and then click Apply to finish.
Trading Strategy with Momentum Indicator in Binomo
To improve trading strategies, trader can combine other indicators or signals with the two signals provided by Momentum.
Trading with Candlestick Colors
To trade, look for reversal candlestick patterns that confirm a trend reversal, which Momentum signals earlier. Trader will need a 5-minute Japanese candlestick chart, a Momentum indicator, and open deals based on the candlestick colors. For example, for UP deals, wait until Momentum forms a trough and then goes up, and look for bullish reversal candlestick patterns such as Bullish Engulfing or Bullish Harami.
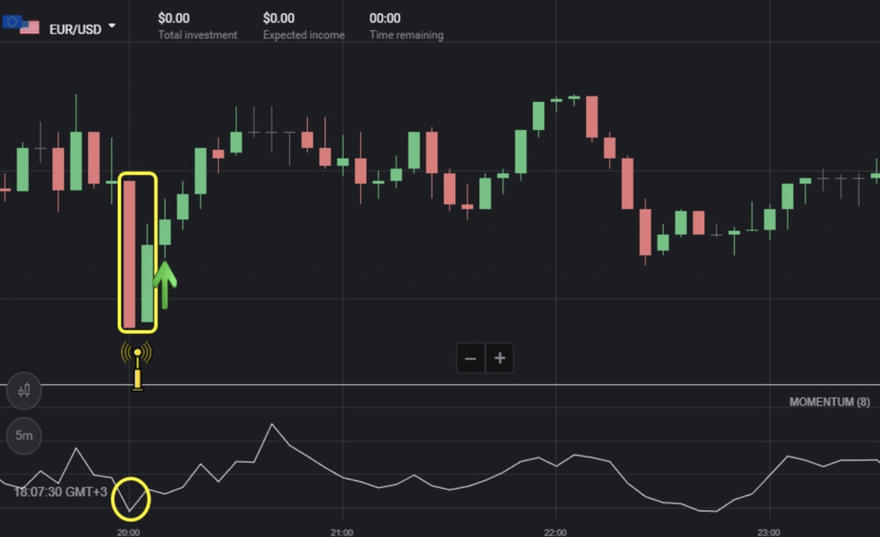
When Momentum forms a peak and then starts to go down, it can indicate that prices will fall. This is often seen with Bearish Engulfing or Harami candlestick patterns.
Combining Long-Term Deals with Reversal Candlestick Patterns
Long-term deals are trades with an expiration time of 15 minutes or more. To enter a trade, look for divergence between the Momentum indicator and the price. A reversal signal can be identified by a special candlestick pattern, such as Morning Star, Tweezer, or Engulfing. To open an UP trade, look for bullish Momentum divergence and a bullish reversal candlestick pattern, such as Bullish Harami, Pin Bar, or Morning Star.
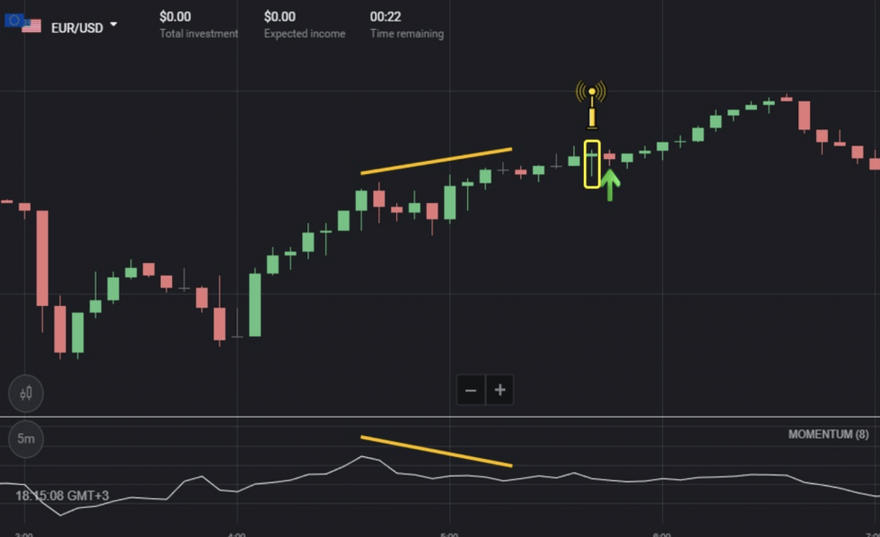
To open DOWN deals, look for a bearish Momentum divergence and a bearish reversal candlestick pattern like Bearish Harami, Pin Bar, Evening Star, etc.
This article introduced a basic indicator. To practice using the Momentum indicator, create a demo account today.