How to Identify Supply and Demand Zones on Binomo
Supply and demand zones are identified as the area of support and resistance levels. However, the concept behind them is different. Support and resistance levels work due to their connection to visible past peaks and bottoms. On the other hand, supply and demand are based on cheap and expensive prices. Demand is formed at the support level and supply at the resistance.
To find supply and demand zones, look for long consecutive candles and identify the reason for the fast price movement, usually sideways fluctuations.
Trading using supply and demand zones on Binomo
When the price enters the demand zone, it typically signals an upward movement, so buy. On Binomo, use currency pairs (CFDs) instead of Fixed Time Trades and set a Stop Loss just below the demand zone (or above the supply zone for sell positions). When the price reaches the supply zone, it usually falls, so enter short. Demand and supply zones can switch roles like support and resistance, and there are several common formations of supply and demand.
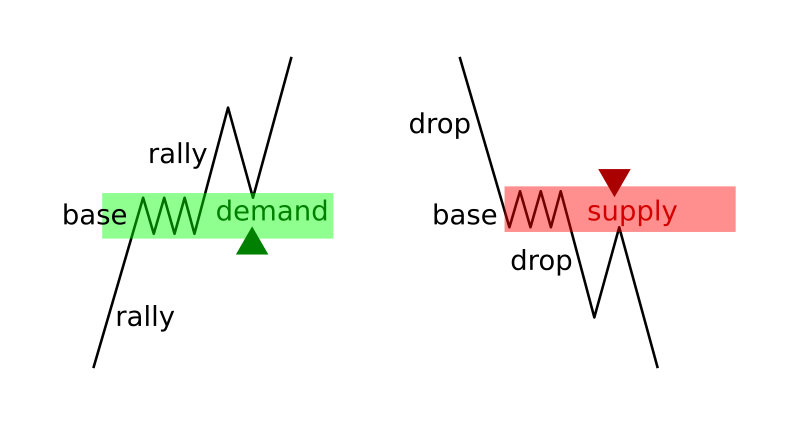
Patterns for Continuing Trends
When the price is going up and then fluctuates, creating a base level and continues to rise afterwards, we can say that a demand area is created. This is called a trend continuation pattern, and it can be used to enter a long position when the price revisits the demand level after the rally.
Similarly, during a downtrend, the pattern is created when the price falls into the base, breaks through, and moves further down. This is called a supply zone, and it can be used to open a sell trade when the price returns to the supply zone after the rally.
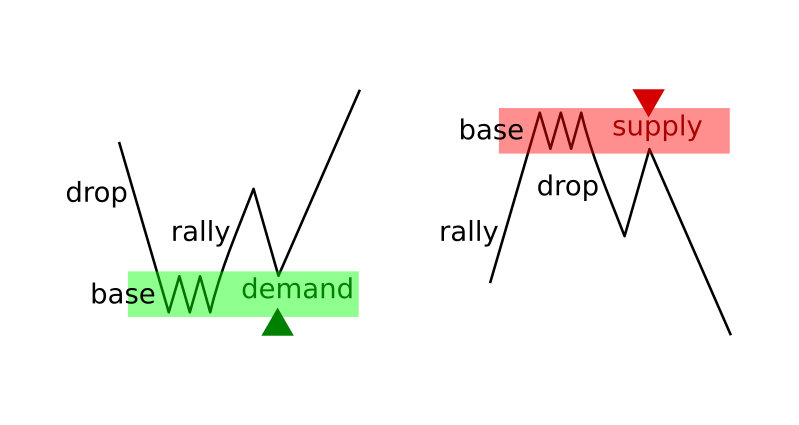
Patterns that indicate a trend reversal
When the price falls and moves within the base, it may change direction and create a demand zone, indicating a possible demand reversal pattern. Open a buy position when the price touches the demand level again.
Similarly, a supply reversal pattern may develop after an uptrend and fluctuation within the base, causing the price to move downward. In this case, open a sell trade when the price revisits a previously created supply zone.
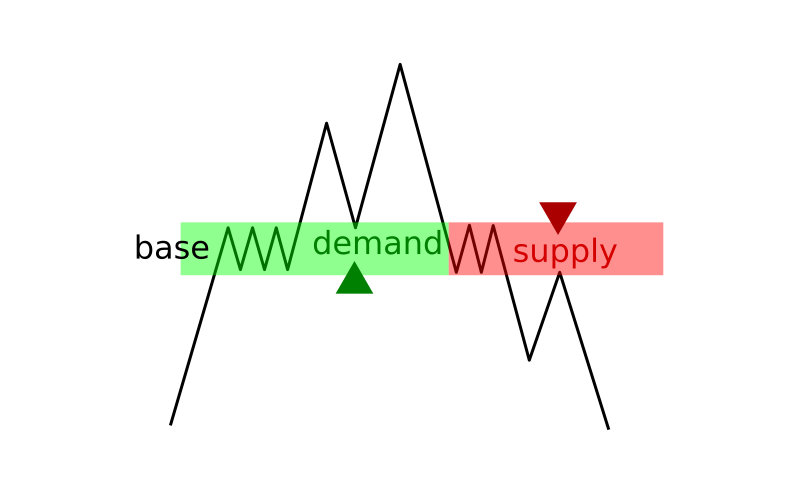
Flip zone
A "flip zone" is when demand turns into supply. These zones will eventually run out as the price moves past them, leaving a new base for a new supply/demand pattern. This indicates that the zone has changed roles.
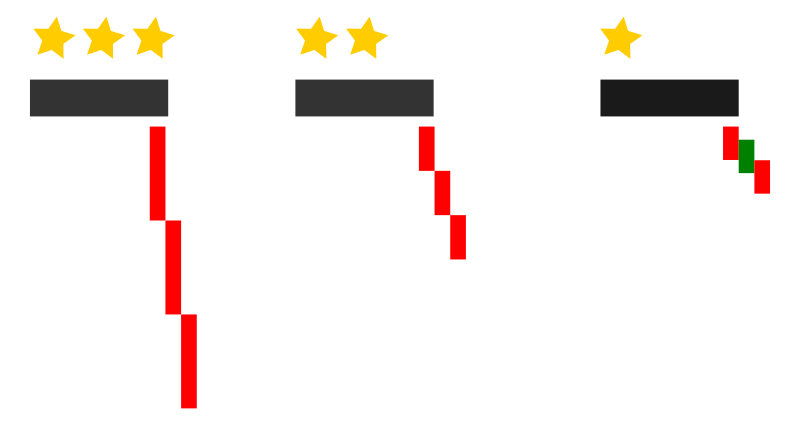
Strength of Demand and Supply
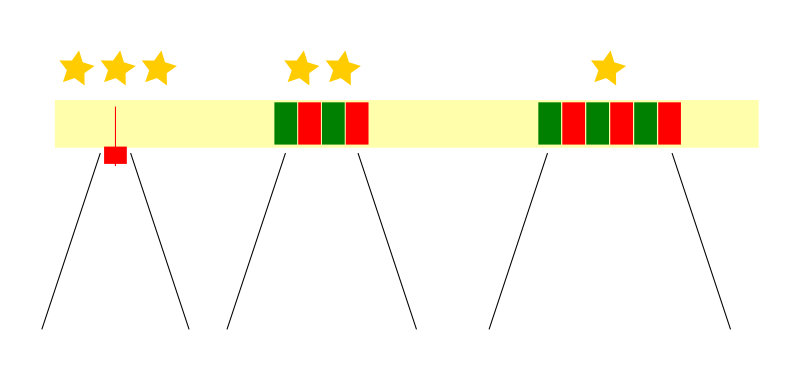
The strength of demand and supply can be measured by the type of candles after a breakout. Long candles of the same colour indicate strong demand or supply. Medium-length candles with occasional retracements still indicate strong zones. Weak demand or supply results in a price movement without much strength.
A short time spent in a supply or demand zone indicates stronger demand or supply, while a longer time spent indicates weaker demand or supply.
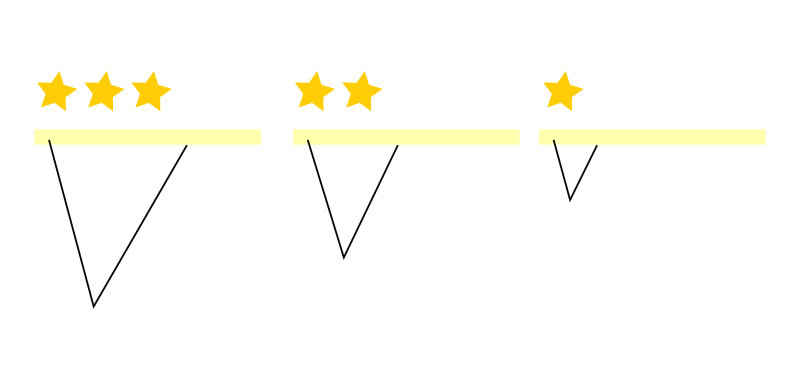
The distance the price moves from demand or supply and back indicates the strength of the levels. If the price moves far away before it returns, the level is strong.
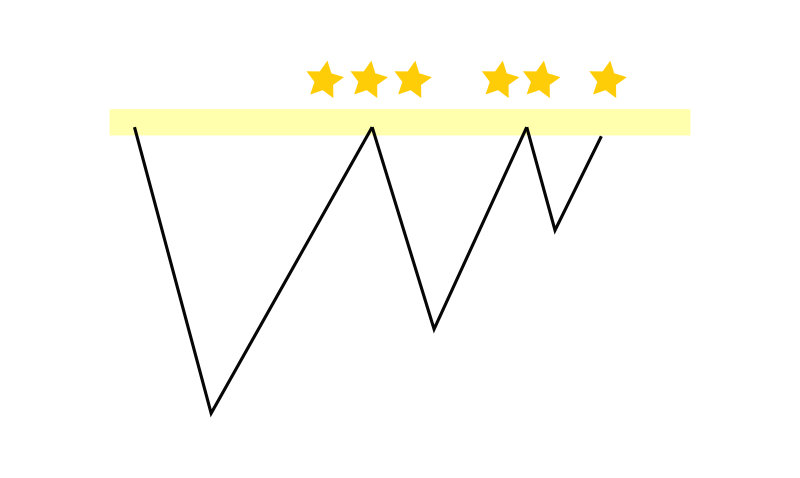
Each time the price returns to the demand or supply zone, it weakens. The zone is strongest the first time the price touches it, and still relatively strong the second time. However, the zone continues to weaken with each subsequent return of the price.
Using demand and supply to trade on Binomo
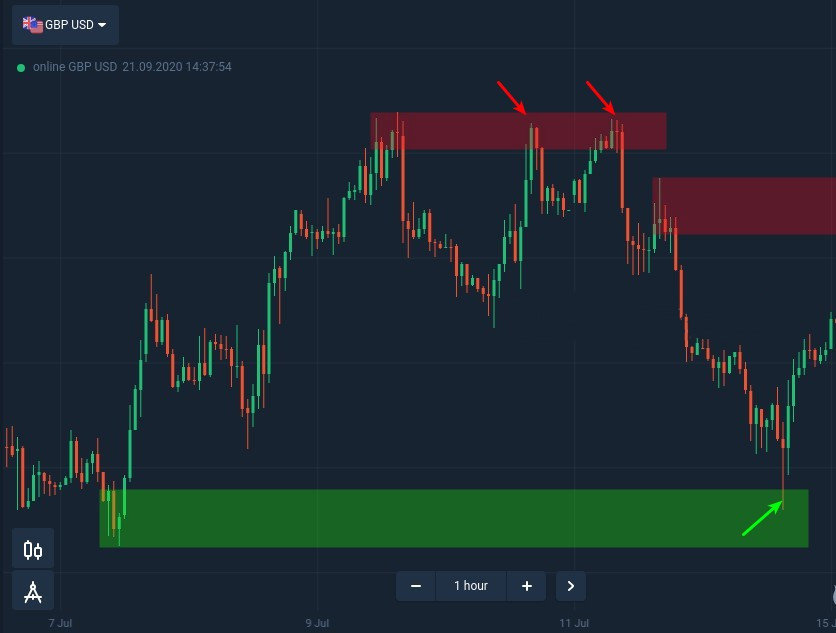
First, identify the demand and supply zones in higher time frames. Then, check how these levels are accepted on the time frame for trading. Wait for a price action signal and enter the trade accordingly. See the example below for an hourly time frame of the GBP/USD currency pair. Enter a trading position when spot a strong demand or supply area.
Binomo offers a demo account with virtual cash to practice identifying supply and demand levels, which can help minimize risk and increase chances of success in trading. While these strategies do not guarantee success, they can be useful for finding entry points. Share experience with trading using supply and demand areas on the Binomo platform in the comments section.